How to Use Debug AVR App - A simulated AVR ATmega328 CPU for Arduino Uno system debugging
To use Debug AVR, start by downloading the Windows app to your Windows computer.
Download Debug AVR (DebugAVRInstall.msi)  for 32-bit Windows (works on 64-bit Windows)
Debug AVR
Debug AVR is a simulated AVR CPU Debugger that might be helpful to the teacher, student, or hobbyist who wishes to develop and debug code for an AVR ATmega328 CPU which is the CPU in an Arduino Uno board.
The current implementation supports commands similar to those that existed in DOS debug.
The Debug AVR version 1.0* is a 32-bit Windows applications that can run on 32-bit or 64-bit Windows.
It is not digitally signed so you will get a warning when you install it that the author is unknown.
If you get a dialog inidicating 'Windows protected your PC', select 'More info', and then 'Run anyway'.
Updates happen a few times a year so if something isn't working, make sure you have the latest version installed.
Also, if you identify any problems please continue to report them to the teraKUHN project.
The latest 1.1* release adds the ability to trigger AVR INT0 and INT1 hardware interrupts,
implements some instructions not completely implemented in earlier versions, and
implements fixes for problems users have reported.
The simulator runs about 10 to 50 times slower than actual hardware.
If you're running code that has delay() statements in your C or C++ code, you can divide the value passed to delay by 10 to get resonable speed.
Walk Through of using Debug AVR to fill in for an Arduino Uno board:
Debug AVR Menu Commands Reference
Select compatible board
If you don't already have Arduino IDE installed, download it and install it.
You might also want to leverage VisualINO if you want a visual programming model instead of the C or C++ programming languages.
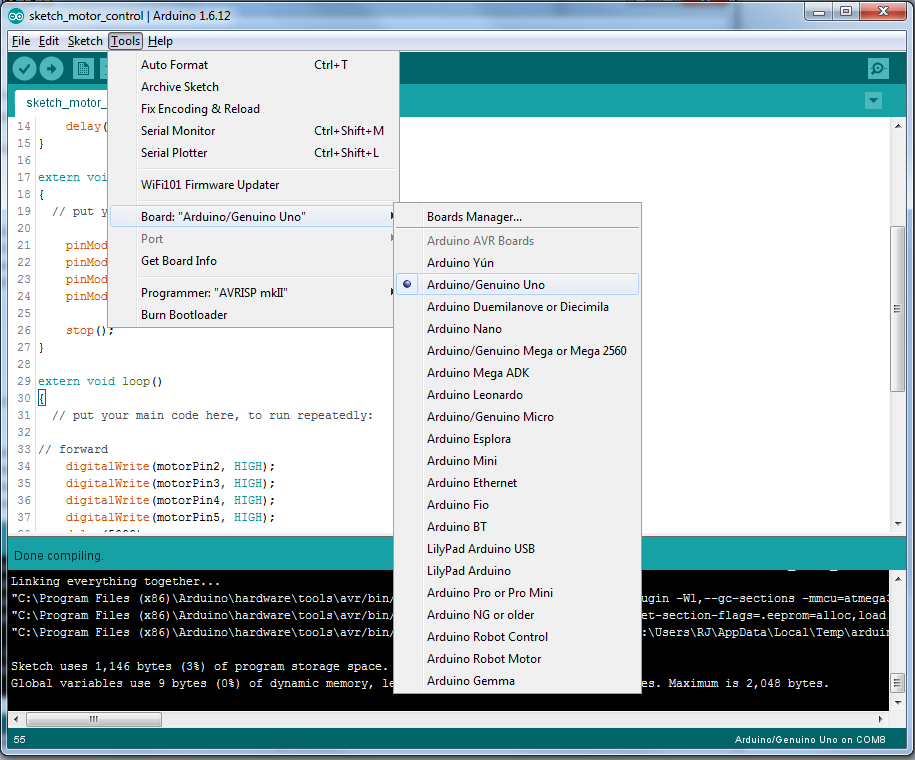
Once installed, start Arduino IDE as you normally would as if you had an Arduino Uno board attached to your PC.
Debug AVR is compatible with an ATmega328 which is the CPU in an Arduino Uno,
so select that as your board type in Arduino IDE under the Tools menu.
Compile code
See this
Arduino Controller
example for code that will flash Debug AVR digital outputs on and off.
Otherwise pick almost any of the numerous pieces of example code that come with Arduino IDE.
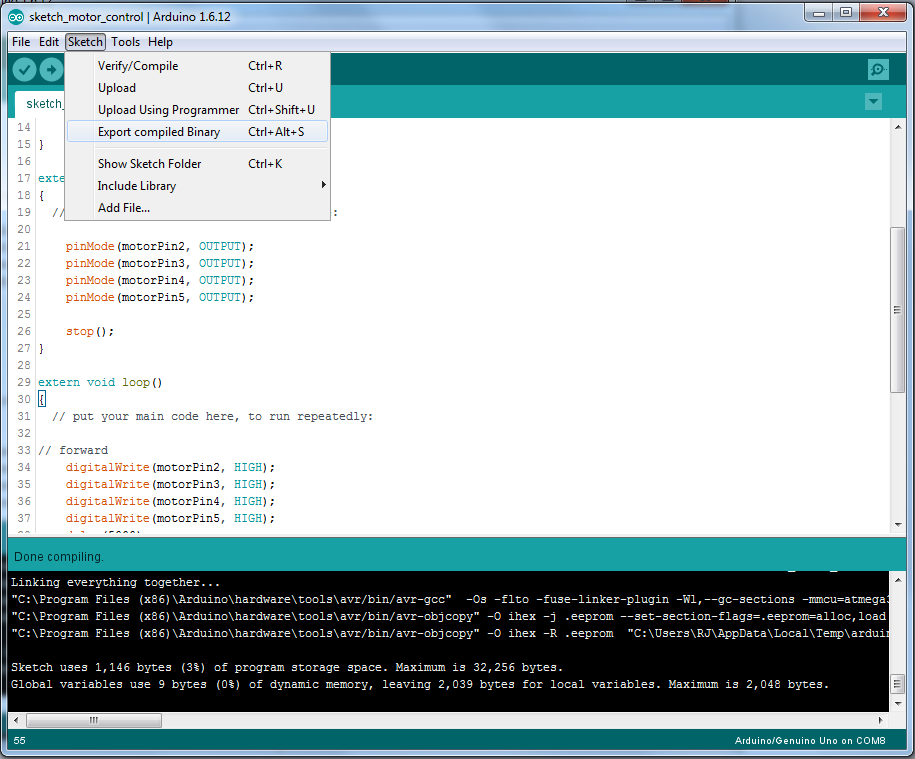
Once you think you're ready to compile and upload your code to an Arduino Uno, instead of uploading to an Arduino Uno board you will select to export compiled binary.
This command under the Sketch menu will create a file on your computer with a *.hex extension in the same directory as your Arduino IDE project.
While not required, you might also find it useful to create an assembly listing file from the tools that come with Arduino IDE.
There are two ways that you are supposed to be able to do this: through avr-gcc.exe with the -S option or avr-objdump.exe.
I have only been able to get the later tool to reliably give me assembly listing files.
This is how to generate an assembly listing file through the later tool.
Unlike most software development environments that build your source code where you save it on disk, Arduino IDE copies your source code to a temporary directory before it compiles it.
If you look at the Arduino IDE command window when you've completed a compile, there will be a number of commands of which one looks something like this:
{tool_path}\avr-gcc ... -o "C:\.../{project_name}.ino.elf" ...
Make a note of the path after -o that specifies the .elf file.
That's the current temporary directory that Arduino IDE used to compile your code.
You will want to create a command using that path.
The command should look something like this:
{tool_path}\avr-objdump.exe -d -S -C "C:\.../{project_name}.ino.elf" > {project_name}.asmlist
This will generate an assembly listing file that you can open with a text editor such as notepad.
If you want to step through or set breakpoints in the AVR assembly code with Debug AVR, this file will give you an idea of what the code is doing.
Load machine code
After installing Debug AVR from it's Windows msi install file, start Debug AVR.
If you get a dialog indicating you don't have the current version of Debug AVR, you're either not connected to the internet or you should download and install the update.
You can load the *.hex memory file into the simulated AVRs main program memory space through two different ways.
The simplest approach is to load the *.hex memory file that has the machine code you want to debug by
loading it through the file open menu.
The other way is to list the memory files in the Debug AVR initialization file (DbgAVR.ini) located in the same directory as the executable (DbgAVR.exe).
The entries in the Debug AVR initialization file include lines that have the path to the memory file followed by ' 0 0'.
ex:
..\BASIC.hex 0 0
The advantage of the later approach is that if you make changes to your code and compile again,
you just need to go to File, Reload New to update and reset Debug AVR with the new code.
Run machine code

At this point you can select Go, Proceed, or Step/Trace commands under the Project menu or on the toolbar.
The Go command will run the code just like if you had uploaded it to an Arduino Uno board.
Once you start the code with the Go or resumed with the Proceed command, you can stop it with the Stop Debug command.
The Proceed and Step commands are for assembly level debugging of the AVR assembly code generated when you compiled and exported your code.
In addition to the menu and toolbar commands, you can run code by entering commands in the text window on the left.
By using the command window, you can enter breakpoint addresses for the Go or Proceed commands to stop at.
You can determine useful addresses to stop your code at by looking at an assembly listing file.
You can also enter the address to start execution at,
and you can enter how many assembly instruction Steps the Trace command should execute.
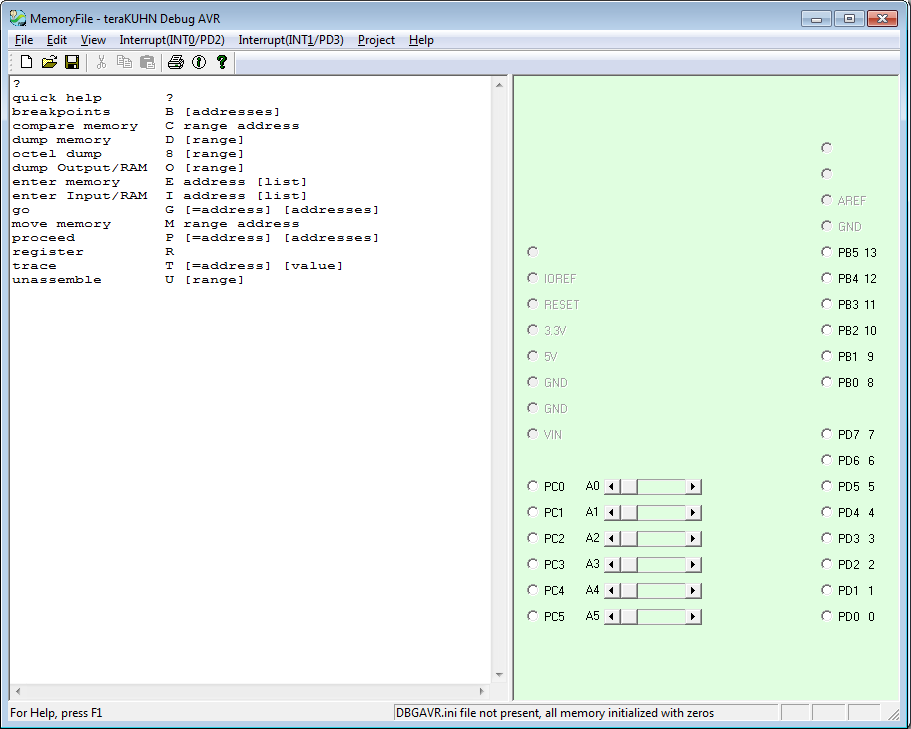
The window on the right displays a simple representation of the Arduino Uno input and output pins.
As your program runs the pins will be white or black indicating the pin would be at 0 volts or 5 volts.
Digital outputs will show bits that are on or 5 volts as black buttons and bits that are off or 0 volts as white buttons.
Digital inputs can be clicked on to toggle between if the input is on (black) or off (white).
Clicking on a bit configured as digital output will generate a beep and will not change it's state.
Analog inputs are controlled by sliders going from minimum value on the left to maximum value on the right.
Buttons that are grey are there to represent pins that you would see on an Arduino board.
Any text that the Ardunio is programmed to send to its serial output port will show up in a simulated 5 line LCD display below the digital and analog controls.
Debug machine code

In addition to the menu and toolbar commands, you can enter other debugging commands in the text window on the left.
Debug AVR uses a text window to allow the user to enter assembly level debugging commands and inspect the state of the CPUs memory, I/O, and registers.
When the code has been stopped, you can use the D or O commands in the command window to dump ROM program memory or RAM memory and I/O ports.
The text window takes single line commands at the end of the text that are described with the following syntax:
| Operation |
Command Syntax |
| quick help |
? |
| breakpoints |
B [addresses] |
| compare memory |
C range address |
| dump memory - hex |
D [range] |
| dump memory - octel |
8 [range] |
| dump Output/RAM |
O [range] |
| enter memory |
E address [list] |
| enter Input/RAM |
I address [list] |
| go |
G [=address] [addresses] |
| move memory |
M range address |
| proceed |
P [=address] [addresses] |
| register |
R |
| trace |
T [=address] [value] |
| unassemble |
U [range] |
where all fields in [] are optional and the fields have the following meaning:
B - breakpoints - Use this command to set breakpoints where you want execution to stop and to echo out what breakpoints are set.
This command can set new breakpoints in the program's code, but will not clear any existing breakpoints.
Breakpoints can only be set at an address containing the first byte of a valid instruction.
Note that DebugCPU replaces the original instructions of any listed breakpoint addresses with a halt, break, or software interrupt.
The instruction at these locations are restored to their original value if the breakpoint is encountered or when the G command is next used.
If DebugCPU does not hit a breakpoint, then the breakpoint is still enabled.
C - compare memory - use this command to compare a range of memory to memory at another location.
D - dump memory - use this command to report what is stored in main program memory in hexidecimal.
8 - octel dump - use this command to report what is stored in main program memory in octel.
O - dump Output/RAM - use this command to report what has been stored in RAM or received by IO ports.
This can also be used to view that AVRs registers which are located between address 00 and 1F.
E - enter memory - use this command to modify what is stored in main memory.
I - enter Input/RAM - use this command to modify what has been stored in RAM or sent to IO ports.
This can also be used to modify the AVRs registers which are located between address 00 and 1F.
G - go - Use this command to start executing code in the debugger. This is the same as selecting Go in the menu command.
This command will clear any existing breakpoints and can set new breakpoints in the program's code.
M - move memory - use this command to move a range of memory to another location.
P - proceed - Use this command to continue executing code in the debugger. This is the same as selecting Proceed in the menu command.
This command can set new breakpoints in the program's code, but will not clear any existing breakpoints.
R - register - use this command to report what is stored in registers.
T - trace - Use this command to execute one or more instruction in the debugger. This is the same as selecting Step or Trace in the menu command.
This command will not clear any existing breakpoints.
U - unassemble - use this command to report what CPU opcodes are stored in main program memory.
address - a 16-bit hexidecimal memory address
addresses - a sequence of up to 8 16-bit hexidecimal memory addresses
value- an 8-bit hexidecimal data value
list - a sequence of up to 8 8-bit hexidecimal data values
=address - =# where # is a 16-bit hexidecimal memory address where something will start
range - either 2 16-bit hexidecimal memory addresses indicating start and end or 1 16-bit hexidecimal memory address indicating start and L # where # is the length to end
In addition to entering single line commands at the end of the text window the Go, Proceed, and Trace commands can be entered through menu commands.
Triggering Interrupt machine code
Interrupt signals may be issued in response to hardware or software events.
A hardware interrupt may be signaled by an external hardware device, e.g., a bump switch on a robot, or detected by devices embedded in the computer e.g., a timer, to communicate that the device needs attention.
An interrupt signal then triggers a change in code execution by the processor to interrupt handler code that deals with the device that needs attention.
In the Debug CPU simulated environment, you can simulate the triggering of the AVR INT0 or INT1 hardware interrupt by clicking on either of the Interrupt(INT0/PD2) or Interrupt(INT1/PD3) menu items.
If Debug CPU is currently executing code, the code execution will switch to the interrupt handling code that is configured for the menu item clicked.
If Debug CPU is not executing code, the next time an instruction is executed, the code will switch to the interrupt handling code.
For most Arduino Uno example code, the code does not include any interrupt handlers,
and the interrupt vector generated will just point to the start of the code.
This makes the behavior of triggering either interrupt similar to a reset.
In order to include an interrupt handler in your code,
you can use attachInterrupt() with the C++ compiler included with the Arduino IDE in order to configure a function as an interrupt handler.
Menu Commands
File menu commands
The File menu offers the following commands:
| Reload New |
Reloads memory and resets processor. |
| Reset |
Resets processor. |
| Open |
Opens an existing document. |
| Save |
Saves an opened document using the same file name. |
| Save As |
Saves an opened document to a specified file name. |
| Exit |
Exits SimpCB. |
Edit menu commands
The Edit menu offers the following commands:
| Undo |
Reverse previous editing operation. |
| Copy |
Copies data from the document to the clipboard. |
| Paste |
Pastes data from the clipboard into the document. |
| Find |
Searches for characters or words in a document. |
| Repeat |
Repeat the last search or replace. |
View menu commands
The View menu offers the following commands:
| Toolbar |
Shows or hides the toolbar. |
| Status Bar |
Shows or hides the status bar. |
Project menu commands
The Project menu offers the following commands:
| Options |
Set Options. |
| Go |
Start executing code in the debugger. |
| Stop Debug |
Stop executing code in the debugger. |
| Step |
Single Step into next instruction. |
| Proceed |
Continue executing with the next instruction. |
Help menu commands
The Help menu offers the following commands, which provide you assistance with this application:
| Online Help |
Offers you a link where you can get help. |
| About |
Displays the version number of this application. |
Disclaimer, Comments on Shareware, and Copyright
Debug AVR is distributed 'as is', so the user bears all responsibility for testing that the functionality is acceptable.
Use Debug AVR at your own risk.
If this software has undesired effects, your sole recourse is to discontinue use of it.
That said, we hope you enjoy using this software and are able to get some practical work accomplished with it.
Feel free to write to us if you have questions, suggestions, feeback, or bug reports regarding it.
Contact us at the teraKUHN project.
Debug AVR is a shareware program.
Please help more people learn about it by pointing friends, classmates, and co-workers at the download location for them to try it.
Please do not redistribute it on your own.
If you use Debug AVR on a regular basis, you are required to register it.
With a registration you will receive an email notification when the next version of the software is available.
To register through PayPal send $5.50 US to teraKUHN@yahoo.com with the program name 'Debug AVR' in the note to seller.
Alternatively send a check for $5.00 US payable to R. J. Kuhn and a note with your email address and the program name 'Debug AVR' to:
R. J. Kuhn
5412 158th Pl NE
Redmond, WA 98052
Software Copyright (C) 2020 - 2024 R. J. Kuhn - All Rights Reserved
Here are some architecture characteristics that can be demonstrated by these two control solutions.
These differences can be used for teaching processor and microcontroller concepts.
control solutions
| Z80 custom with KIOS |
AVR Arduino |
|
CISC
|
RISC
|
|
von Neumann architecture
|
Harvard architectures
|
|
Run-time software abstraction layer
|
Compile time coding abstraction macros
|
|
custom electonics board
|
pre built Arduino board
|
|
|
|
Text Copyright (C) 2020 - 2026 R. J. Kuhn.
Please note that you are not allowed to reproduce or rehost this page without written permission.